Twelve live regions, two being built, and the real numbers for each
A 400 Gbps private backbone between every region, 20 Tbps of always-on DDoS scrubbing, and Tier III or IV facilities throughout. Pick a region at signup and move it later for free.
- 0
- Live regions
- 0.0 ms
- Median RTT to nearest IX
- 0+
- Carrier connections
- 0 MW
- Contracted power
Where your workload can physically sit
Hover a marker for its latency, tier and carrier count. Dimmed markers are regions with hardware racked but not yet accepting traffic — we would rather show you those than pretend they are live.
FrankfurtFRA
LiveTier IVGermany · Europe
- Latency
- 3 ms
- Capacity
- 22 MW
- Carriers
- 63
Hover or tab through a marker to inspect a region. Latency is the median round trip measured from the nearest major metro over the last 30 days.
Every facility, with what is actually in it
Latency is the 30-day median round trip to the nearest major internet exchange. Capacity is contracted power, not theoretical draw.
Americas
2 live · 4 buildingAshburn
United States
- Latency
- 4 ms
- Tier
- Tier IV
- Power
- 18 MW
- Carriers
- 42
Dallas
United States
- Latency
- 6 ms
- Tier
- Tier III
- Power
- 12 MW
- Carriers
- 31
Kansas
United States
- Latency
- 5 ms
- Tier
- Tier III
- Power
- 8 MW
- Carriers
- 24
Manassas
United States
- Latency
- 4 ms
- Tier
- Tier IV
- Power
- 20 MW
- Carriers
- 35
Toronto
Canada
- Latency
- 7 ms
- Tier
- Tier III
- Power
- 8 MW
- Carriers
- 22
São Paulo
Brazil
- Latency
- 11 ms
- Tier
- Tier III
- Power
- 6 MW
- Carriers
- 19
Europe
4 live · 1 buildingLondon
United Kingdom
- Latency
- 3 ms
- Tier
- Tier IV
- Power
- 15 MW
- Carriers
- 51
Frankfurt
Germany
- Latency
- 3 ms
- Tier
- Tier IV
- Power
- 22 MW
- Carriers
- 63
Amsterdam
Netherlands
- Latency
- 4 ms
- Tier
- Tier III
- Power
- 11 MW
- Carriers
- 47
Helsinki
Finland
- Latency
- 5 ms
- Tier
- Tier III
- Power
- 7 MW
- Carriers
- 18
Nuremberg
Germany
- Latency
- 4 ms
- Tier
- Tier III
- Power
- 10 MW
- Carriers
- 25
Asia Pacific
4 live · 2 buildingSingapore
Singapore
- Latency
- 6 ms
- Tier
- Tier IV
- Power
- 14 MW
- Carriers
- 38
Tokyo
Japan
- Latency
- 5 ms
- Tier
- Tier IV
- Power
- 13 MW
- Carriers
- 34
Sydney
Australia
- Latency
- 9 ms
- Tier
- Tier III
- Power
- 7 MW
- Carriers
- 21
Mumbai
India
- Latency
- 7 ms
- Tier
- Tier III
- Power
- 9 MW
- Carriers
- 26
Noida
India
- Latency
- 6 ms
- Tier
- Tier III
- Power
- 5 MW
- Carriers
- 14
Chennai
India
- Latency
- 7 ms
- Tier
- Tier III
- Power
- 6 MW
- Carriers
- 16
Middle East & Africa
0 live · 2 buildingDubai
UAE
- Latency
- 8 ms
- Tier
- Tier III
- Power
- 5 MW
- Carriers
- 17
Johannesburg
South Africa
- Latency
- 12 ms
- Tier
- Tier III
- Power
- 4 MW
- Carriers
- 12
Ashburn and Dallas and Toronto and São Paulo and London and Tokyo and Sydney and Dubai and Johannesburg are not live yet
Join the waitlist and we will email you on the day each opens. No marketing in between.
The specifications behind the uptime number
Redundancy is expensive and boring, which is exactly why it is worth publishing rather than summarising as 'enterprise-grade'.
Backbone capacity
400 Gbps
Private, redundant, non-blocking between all live regions
Peering partners
1,240+
Direct peering at 19 internet exchanges
DDoS scrubbing
20 Tbps
Always-on, no traffic redirection during an attack
Power redundancy
2N + 1
Dual utility feeds, flywheel UPS and diesel generators
Cooling
N + 1
Free-air cooling where climate allows, PUE averaging 1.18
Physical security
5 layers
Mantraps, biometrics, 24/7 guards, 90-day camera retention
What keeps a rack alive when something breaks
2N + 1 power
Two independent utility feeds, flywheel UPS bridging to diesel, and 48 hours of fuel on site with a refuelling contract on top.
N + 1 cooling
Free-air cooling where the climate allows it, hot-aisle containment everywhere, and a fleet PUE averaging 1.18.
Diverse fibre paths
At least three physically separate entries per facility, on separate conduits, with no shared manhole between them.
Five security layers
Perimeter, lobby, mantrap, cage and rack — biometrics at three of them, 24/7 guards, and 90 days of camera retention.
Pre-action fire suppression
Very-early-smoke-detection air sampling with a dry-pipe pre-action system, so a false alarm does not soak your servers.
Always-on DDoS scrubbing
20 Tbps of capacity filtering inline. No redirection to a scrubbing centre mid-attack, so nothing hiccups when one starts.
Real racked nodes. Zero reseller intermediaries.
Unlike white-label hosts that resell third-party VPS slices, SrvDaddy and SrvCloud Technologies own, assemble, and rack physical enterprise compute nodes directly into Tier III & IV colocation suites.
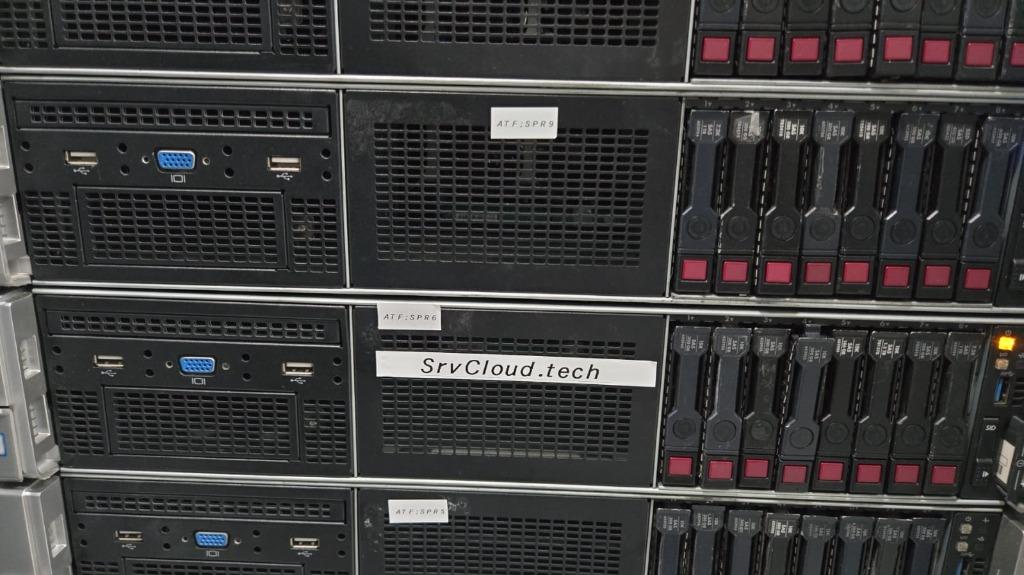
Node Fleet: SPR5 · SPR6 · SPR9 Live Cluster
High-density multi-tenant nodes deployed with high-speed ECC RAM, redundant enterprise storage arrays, and dual 10Gbps/40Gbps uplinks per rack unit.
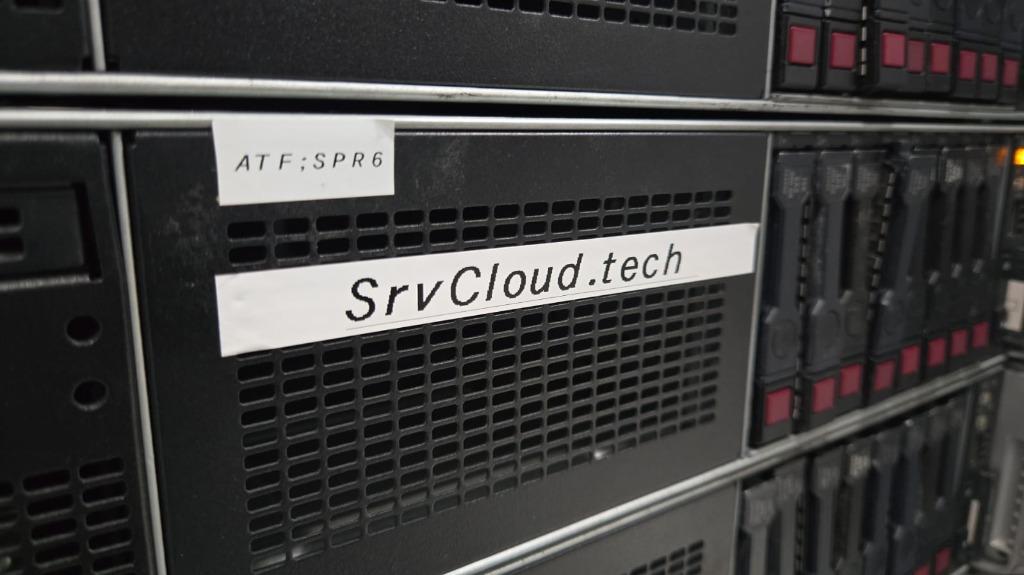
SrvCloud.tech Production Server
Every server node is physically branded, tracked, and monitored 24/7/365. When a drive throws SMART warnings, on-site data center technicians hot-swap it without downtime.
Your traffic stays on our backbone as long as possible
We announce our own space from AS207544 and peer directly at nineteen exchanges. Between regions, packets travel on private 400 Gbps capacity rather than the public internet — which is why a London-to-Singapore hop is predictable rather than merely fast on a good day.
- Anycast DNS answered from 14 locations
- BGP communities exposed so you can influence your own routing
- RPKI signed and validated in both directions
- Automatic transit withdrawal when a carrier degrades
$mtr --report-wide sgp1.srvdaddy.net
1 edge-lhr1 0.3ms 0.0% loss
2 core-lhr1 0.6ms 0.0% loss
3 bb-lhr-fra 7.1ms 0.0% loss
4 bb-fra-dxb 48.4ms 0.0% loss
5 bb-dxb-sgp 92.7ms 0.0% loss
6 core-sgp1 93.1ms 0.0% loss
# 6 hops, all ours, zero public transit
Certifications that cover the whole fleet
Not “available in select regions” — every live facility is in scope. Reports are available under NDA and we will complete your vendor questionnaire without charging a fee for it.
Power, honestly accounted for
- 0%
- Renewable-matched electricity
- 0.00
- Fleet average PUE
- 0 yrs
- Server refresh cycle
Matched annually with certificates, not hour-by-hour. We say so because the difference matters.
Measured at the facility meter across twelve live regions, twelve-month trailing.
Then resold or recycled through an R2-certified processor, with certificates of destruction for drives.
Infrastructure questions
Including the ones with awkward answers.
Not covered here?
Live chat is staffed by engineers, not a script. Median first reply is 96 seconds, around the clock.
Open the help centreWe own the racks, the servers, the switching and the storage. The buildings, power and cooling are operated by colocation partners — Equinix, Digital Realty and two regional operators — because building datacenters is a different business from running them well. We publish which partner runs which region on request.
Ready when you are
Choose a region and deploy into it in under a minute
Every plan lets you pick a region at signup, and moving later is free. If you are not sure which, tell us where your users are.